The Proposition
IDRCIN is not proposed to add more technology to Imbak Canyon. It is proposed to obtain more continuous and spatially distributed scientific knowledge while reducing unnecessary physical intervention.
Designed for a living rainforest
Imbak Canyon is treated as a conservation and research environment first. Technology remains subordinate to scientific and ecological priorities.
Human when necessary
Field science remains essential where physical sampling, ecological judgement or ground-truthing is required. IDRCIN reduces unnecessary human presence; it does not replace researchers.
System Architecture
The architecture deliberately moves complexity away from lightweight sensor points and concentrates resilience, storage and intelligence at the DAQ and cloud layers.
Research Intelligence
NeuralOps Detached Systems operate at Zonal DAQ, Main DAQ and cloud levels to validate data, detect early conditions and support researcher-defined decision intelligence.
Raw Data
Original measurements are preserved and remain available for scientific audit and re-analysis.
Validated Data
Noise, duplicates, timestamp issues, drift and suspicious values are flagged through auditable rules.
Projection
Historical and real-time patterns can generate advisory projections with confidence, assumptions and time horizon shown.
Presence vs Impact
The system does not claim zero impact. It asks a harder question: which method produces the required scientific value with the lowest reasonable total ecological disturbance?
Routine human presence
Routine deployment, inspection and retrieval are designed for drone operation, while human fieldwork remains available whenever science or safety requires it.
Spatial flexibility
Sensor sets can rotate between research zones after six or twelve months, expanding cumulative coverage without permanent instrumentation at every site.
ESG & Carbon
IDRCIN accounts for presence, energy and carbon honestly measured, not assumed.
Less routine presence
Drone-deployed, retrievable sensing reduces repeated human access, transport and persistent field footprint compared with conventional manual monitoring.
Local, on-demand intelligence
Validation runs on-premise via NeuralOps Detached Systems; heavy cloud LLM is used sparingly, keeping energy and carbon proportional to need.
IDRCIN targets carbon reduction at the physical research layer by reducing repeated field mobilisation. NeuralOps targets carbon reduction at the digital intelligence layer by reducing unnecessary AI processing.
IDRCIN vs Conventional / Manual Monitoring
NeuralOps vs Full-AI Processing
NeuralOps reduces unnecessary AI computation.
From Estimated → Measured
Physical Layer
- vehicle kilometres
- fuel consumption
- drone battery kWh
- number of missions
- human field hours
Digital Layer
- total tokens
- model calls
- server / DAQ electricity
- cloud workload · storage · network
Balanced SWOT
Every advantage is paired with its limitation and a response strategy. Robustness comes from layered design, not claims of perfection.
Strengths
- Drone-first, low routine human entry
- Lightweight distributed sensing
- Retrievable and reusable research layer
- Zonal intelligence and layered storage
- Temporal Digital Twin and projections
Weaknesses
- High R&D integration complexity
- Canopy mapping remains imperfect
- Fibre and retrieval behaviour require field proof
- Drone endurance constraints
- Projection accuracy requires historical validation
Opportunities
- Rainforest microclimate and biodiversity research
- Hydrology and climate resilience studies
- Research-as-a-platform for multiple institutions
- Long-term Sabah environmental intelligence
- Replication to other conservation landscapes
Threats
- Extreme weather and wildlife interaction
- Regulatory limitations
- Connectivity and cyber risk
- Technology obsolescence
- Scaling beyond ecological justification
Key Risks & Response
Critical risks are designed into the operating model rather than hidden from the proposal.
Recommended Pilot
IMBAK recommends a joint research and engineering pilot before any large-scale deployment.
Engineering KPI
Deployment success, sensor uptime, DAQ uptime, fibre integrity, communication and retrieval performance.
Scientific KPI
Data completeness, validation quality, alert accuracy, traceability and usefulness to researchers.
Ecological KPI
Visible disturbance, bird and wildlife interaction, drone presence, fibre behaviour and post-retrieval condition.
More knowledge per unit of ecological presence.
IDRCIN is designed to help Yayasan Sabah and research partners understand Imbak Canyon more continuously, more spatially and more intelligently while reducing unnecessary physical intervention wherever practical.
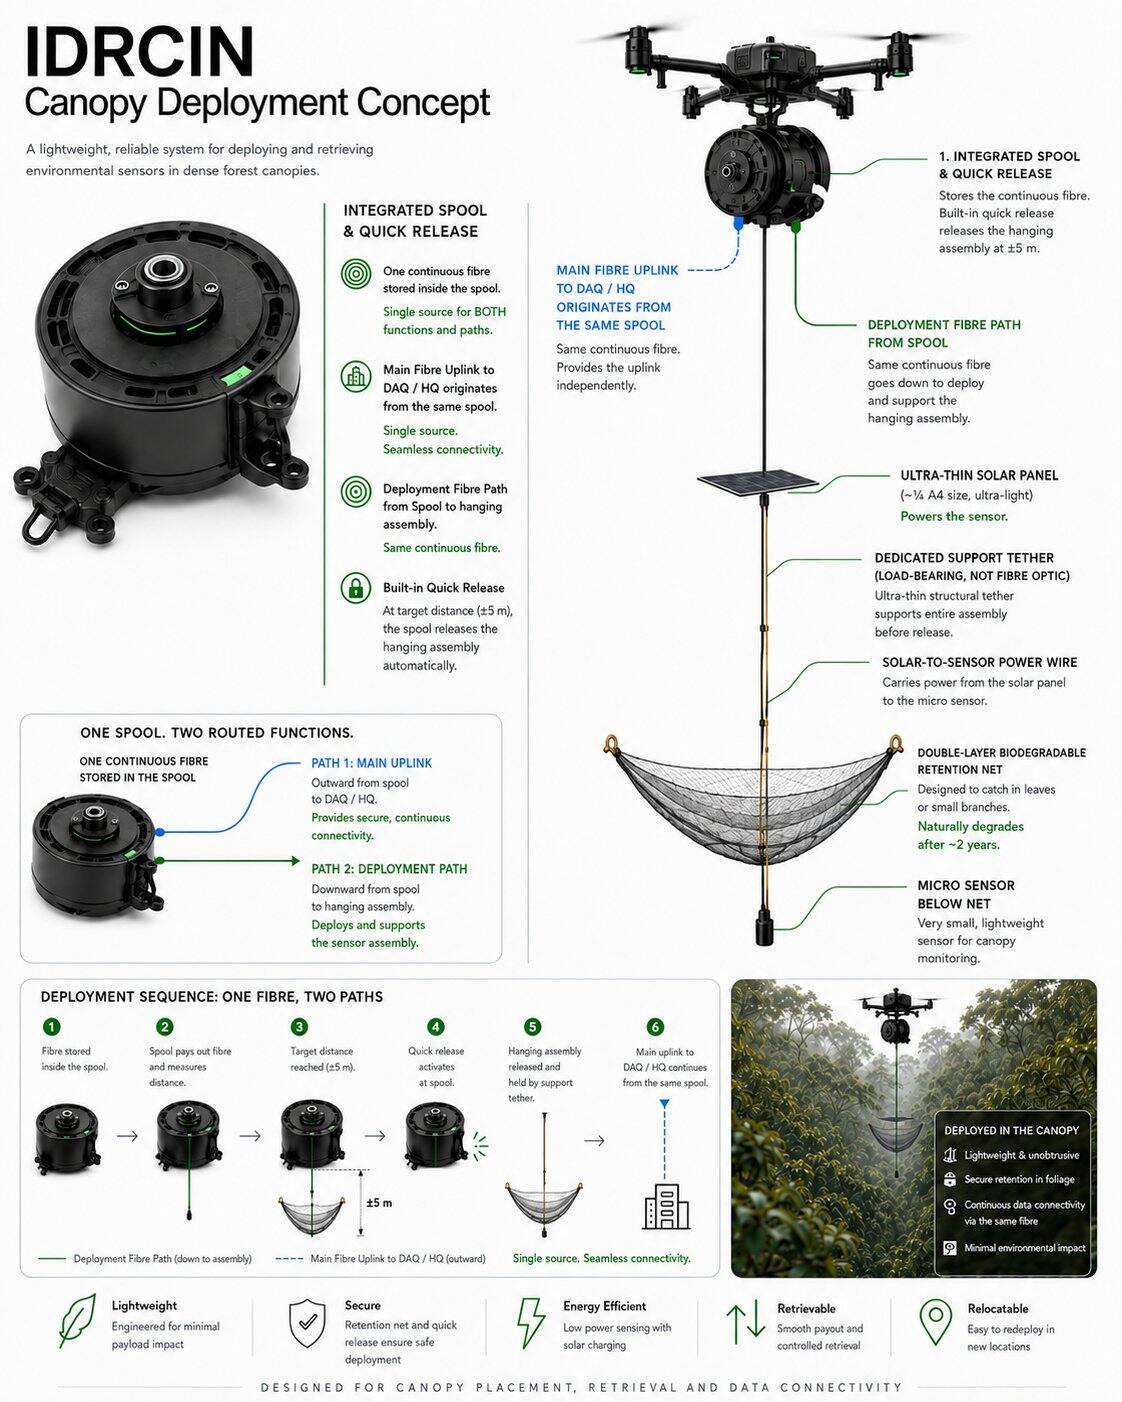
Continuous, spatially distributed scientific knowledge with minimal physical presence beneath the canopy.